
In metro Atlanta, the same total knee replacement, performed in the same kind of facility, carries very different prices depending on who owns the surgery center. Across the market’s freestanding ambulatory surgery centers (ASCs), the average commercial institutional (facility) reimbursement for the procedure runs about $12,200 at independently owned centers, about $15,100 at private equity owned centers, and about $21,200 at system-owned centers. The operation is identical, the type of facility is identical, and the institutional rate is measured on the same procedure. What moves the price is ownership.
Holding the procedure and the ASC setting constant turns ownership into the variable under test. In Atlanta, the negotiated rate moves with the market power of the owner.
The question on cost
When one facility is paid more than another for the same service, the explanation offered is cost. In any industry, understanding what it costs to run an operation is difficult without being on the inside, and healthcare is no different. The usual version of that explanation points to the setting: a hospital outpatient department carries standby capacity and institutional overhead that a freestanding office does not, so it is paid more.
That explanation cannot do the work here, because the setting is held constant. Every facility in this analysis is a freestanding ambulatory surgery center, billing the institutional facility rate for the same procedure. The buildings are comparable and the procedure is identical. The difference that remains is ownership, and the question is what ownership is worth in the negotiated rate.
Site of service still sets the floor and the ceiling. The same procedure moves up a predictable ladder, from an independent office with no facility fee, to a freestanding surgery center, to a hospital outpatient department, to a full inpatient stay, with the institutional component growing at each step. This analysis holds at one rung of that ladder, the ambulatory surgery center, and varies the owner instead. It isolates the part of the rate that the building cannot explain.
What determines the value
A rate that tracks cost and a rate set by negotiation behave differently. When a hospital system or a private equity platform acquires an independent surgery center, the building, the staff, and the procedure can stay the same while the negotiated rate moves. What changes is the owner, and the negotiating position the owner brings to the contract.
The research on consolidation points in the same direction. Vertical acquisitions of physician practices by hospitals have been associated with price increases near 14 percent for the same services. [1] Prices at facilities with no local competition run about 12 percent above markets with several rivals, after adjusting for the care provided. [2] Outpatient prices at system-affiliated facilities have historically run above independent ones. [3] In each case, what changed was market position and billing classification.
A larger owner also has more purchasing power with suppliers and a broader base to spread fixed costs across. If the rate tracked cost, that scale should push it down. The Atlanta data moves in the other direction, with the largest owners commanding the highest rates, which is difficult to reconcile with a purely cost-based explanation. How much of the difference is margin could be measured against public cost-report data.
The data: ownership in one market
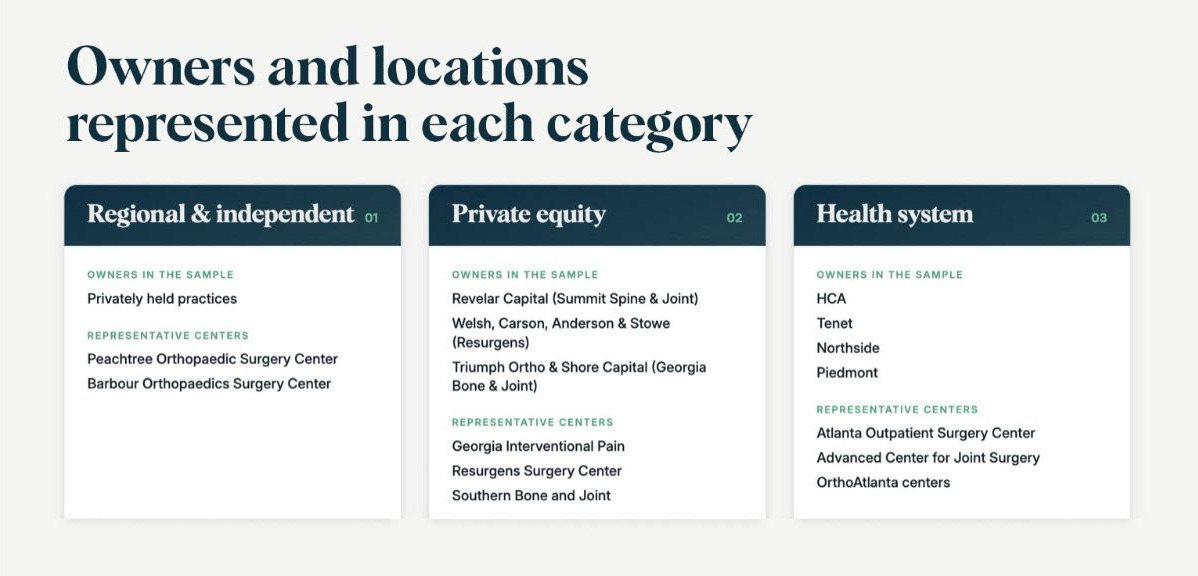
Payerset analyzed commercial institutional rates at freestanding ambulatory surgery centers in metro Atlanta for three orthopedic procedures: rotator cuff repair, billed as CPT 23410 and 23412, and total knee replacement, CPT 27447. Each center was sorted into one of three ownership categories.
- System centers are owned by a large hospital system.
- Private equity centers are owned by a private equity backed platform.
- Regional centers are independently held, owned by a single practice or group.
Across all three codes, the average rate rose in the same order: regional lowest, private equity in the middle, system-owned highest.
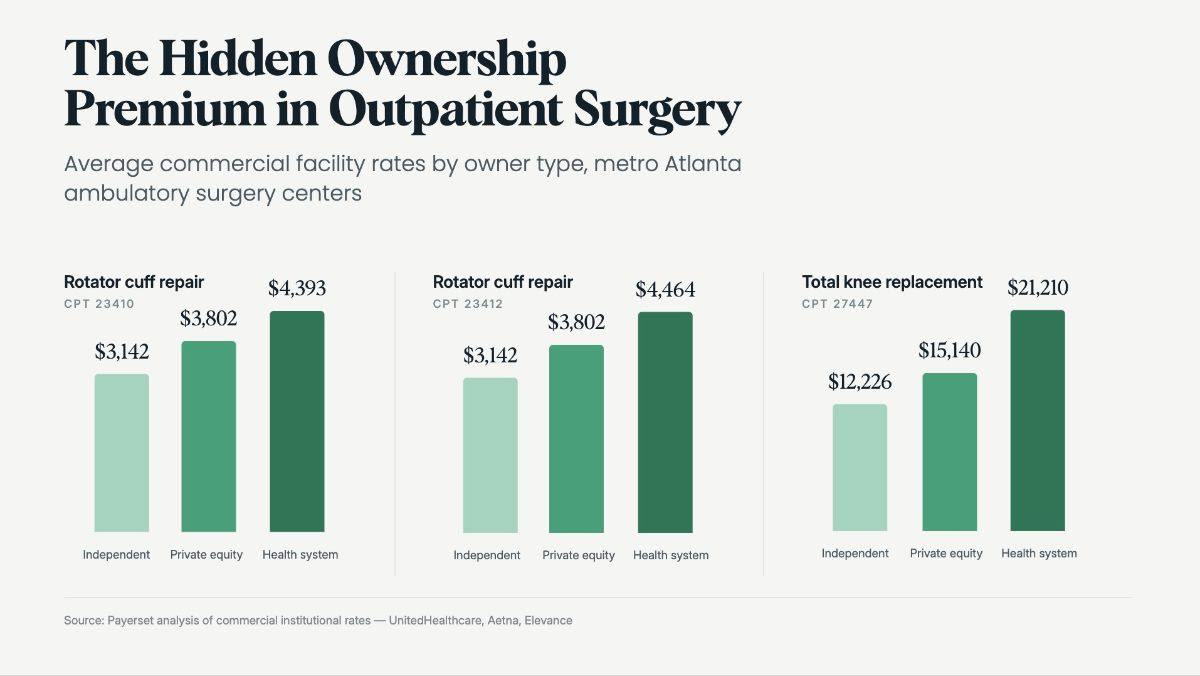
The pattern is consistent across procedures, and the gap widens with the size of the bill. On rotator cuff repair, the system average runs about 40 percent above the independent average. On total knee replacement, where the dollars are larger, the system average of about $21,200 is roughly 73 percent above the independent average of about $12,200, with the private equity average sitting between them. Each category contains named owners that a reader in this market would recognize.
How this was measured
The figures are average commercial institutional rates, the facility side of the bill, with no professional or modifier components, drawn from Payerset claims and rate data across UnitedHealthcare, Aetna, and Elevance. System ownership is identifiable directly in the data. Private equity and regional ownership were confirmed through secondary research on portfolio holdings and practice records. Rates below the Medicare outpatient allowable were excluded as likely misreported professional fees, and rates above 500 percent of Medicare were excluded as likely hospital rates misattributed to surgery centers. Claims data was used to identify Atlanta as a strong market for the analysis and to confirm that the selected procedures are ones these surgery centers bill, so the comparison reflects services performed at each facility.
Reading the market
Two things stand out inside the averages. The system category is not uniform, and rates within it range widely, which reflects the different market positions of the systems involved. The private equity category contains at least one platform whose knee replacement rates approach the system level, well above the other private equity owners in the sample. Ownership type tracks the rate, and so does the scale and reach of the specific owner.
When a small number of systems and platforms own most of the surgery centers in a market, the variation does not describe open competition. It describes a market where a few owners set the price, and where the procedure rate follows the market position of whoever owns the room it is performed in. [7] The fewer the participants, the wider the possible range of outcomes, and the harder it is for an outside party to tell whether a given rate reflects the cost of care or the standing of its owner.
If the rate measured the value of the surgery, it would not change with the name on the building. The procedure is the same in all three settings. What changes is the negotiating position behind it, and the size of the gap is the distance between what the surgery is worth and what it is paid.
What policy reaches
Policy has mostly approached this through site of service. Federal site-neutral rules, which aim to pay the same for a service regardless of where it is delivered, sit inside Medicare and address the gap between hospital and non-hospital settings. [4] They do not reach commercial contracts, and they do not address variation among facilities of the same type. New York’s Fair Pricing Act takes a different approach, capping a set of routine commercial services at 150 percent of the Medicare non-hospital rate and targeting the rate itself. [5] A Brown University analysis estimated a cap of that kind could have saved more than $1 billion in a single year across part of the state’s commercial population. [6] Neither framework directly addresses the ownership-based variation visible in the Atlanta data, where every facility is already a surgery center.
Reading the rate before the next contract
For anyone benchmarking these rates, ownership is a variable to track. Two surgery centers a few miles apart, performing the same procedure, can carry rates that differ by half or more, and the difference follows who owns them. Benchmarking that accounts for ownership, alongside site of service and code, surfaces a part of the rate that a blended average will bury.
The rate a facility commands for a standard procedure can be read as a signal of its owner’s market power. It does not prove cost or position to the dollar, and the data has limits. The regional sample is small, ownership of independent centers is harder to confirm because system ownership shows up directly in the data and independent ownership does not, and a single owner’s rates can swing the average in a thin category. What the data shows plainly is that in one concentrated market, for three standard procedures, the price of surgery rose with the market power of whoever owned the center. For a team preparing for the next contract, that is the place to start.
Notes
- Yale News. Hospital takeovers of physician practices drive up health care prices, study finds. August 2025.
- Cooper, Craig, Gaynor, and Van Reenen. The Price Ain’t Right? Hospital Prices and Health Spending on the Privately Insured. Quarterly Journal of Economics, 2019.
- Health Care Cost Institute. Outpatient hospital prices are higher among system-affiliated, for-profit, and urban hospitals.
- Congressional Research Service. Medicare’s Site-Neutral Payment Policy. In Focus IF13233. 2026.
- New York State Senate. Bill S705 / Assembly A2140 (Fair Pricing Act), 2025-2026.
- Brown University, Center for Advancing Health Policy through Research. Estimating savings from the Fair Pricing Act and commercial site-neutral payment.
- MedPAC. Hospital consolidation and its implications for Medicare.