This is Part Two of a series on using price transparency data for benchmarking. You can take a look at Part 1 here.
We recently helped a customer work through one of the most common questions we hear in managed care: am I getting paid more or less for emergency visits than the other hospital in my market?
It sounds like a simple question. It turns out to be anything but.
The conversation started because an analysis had been circulating comparing commercial emergency visit reimbursement between two competing health systems in the same city. The conclusion was clean and quotable: Hospital A receives 1.5x more than Hospital B for emergency visits from the same commercial payer. Attention-grabbing for sure. But when we worked through the methodology behind it, the numbers told a very different story.
We want to be upfront about something. We are not sharing this to point fingers at anyone. Price transparency data is genuinely new territory, and figuring out how to use it well is a challenge the whole industry is working through together. What we can offer is what we have learned from doing this work with customers over time.
The Problem with Single-Code Comparisons
We are going to use Emergency visits as an example, but the lessons in this post apply to a variety of different services.
The original analysis pulled one billing code, 99284 (a Level 4 emergency visit), directly from hospital machine-readable files and compared the estimated reimbursement between two hospitals. That seems like a reasonable starting point. In practice, it produced a conclusion that was the opposite of what the full picture showed, for two reasons:
First, it only captured a piece of total charges.
An emergency visit generates two separate components: a facility fee and a professional fee. The facility fee covers the hospital’s resources, the room, the nursing staff, the equipment. The professional fee covers the physician or clinician who evaluates and treats the patient. These can appear on separate claims, be negotiated separately, involve physician groups, and vary independently from one organization to another.
The original analysis looked only at the facility reimbursement for 99284 and left the professional component out entirely.
Second, a 99284 is rarely the only code billed for an emergency visit. It’s often one line item.
When a patient comes in with chest pain, the 99284 is just the starting point. What follows is a cascade of additional services: blood draws, an EKG, imaging, IV access, medications, and more. The professional charges for a physician-patient evaluation can originate from an independent physician group partnered with the hospital. Each of those generates its own billing code, and each of those codes can be negotiated separately. The reimbursement differences across those codes, especially in labs, can end up being far larger than anything you would see on the E/M code alone.
Comparing two hospitals on 99284 in isolation is like comparing two restaurants on the price of one ingredient and calling it a full meal comparison. You will get a number, but it rarely tells you the entire story.
What a Real Comparison Looks Like: Start with the Bundle
When we work through questions like this with customers, the first thing we do together is define what we are actually pricing before touching any data. For an emergency visit, that means building a clinically grounded bundle of billing codes that reflects how a real visit is actually billed.
For a standard Level 4 ED visit with a chest pain and cardiac workup presentation, here’s an example of a core bundle we would work with:
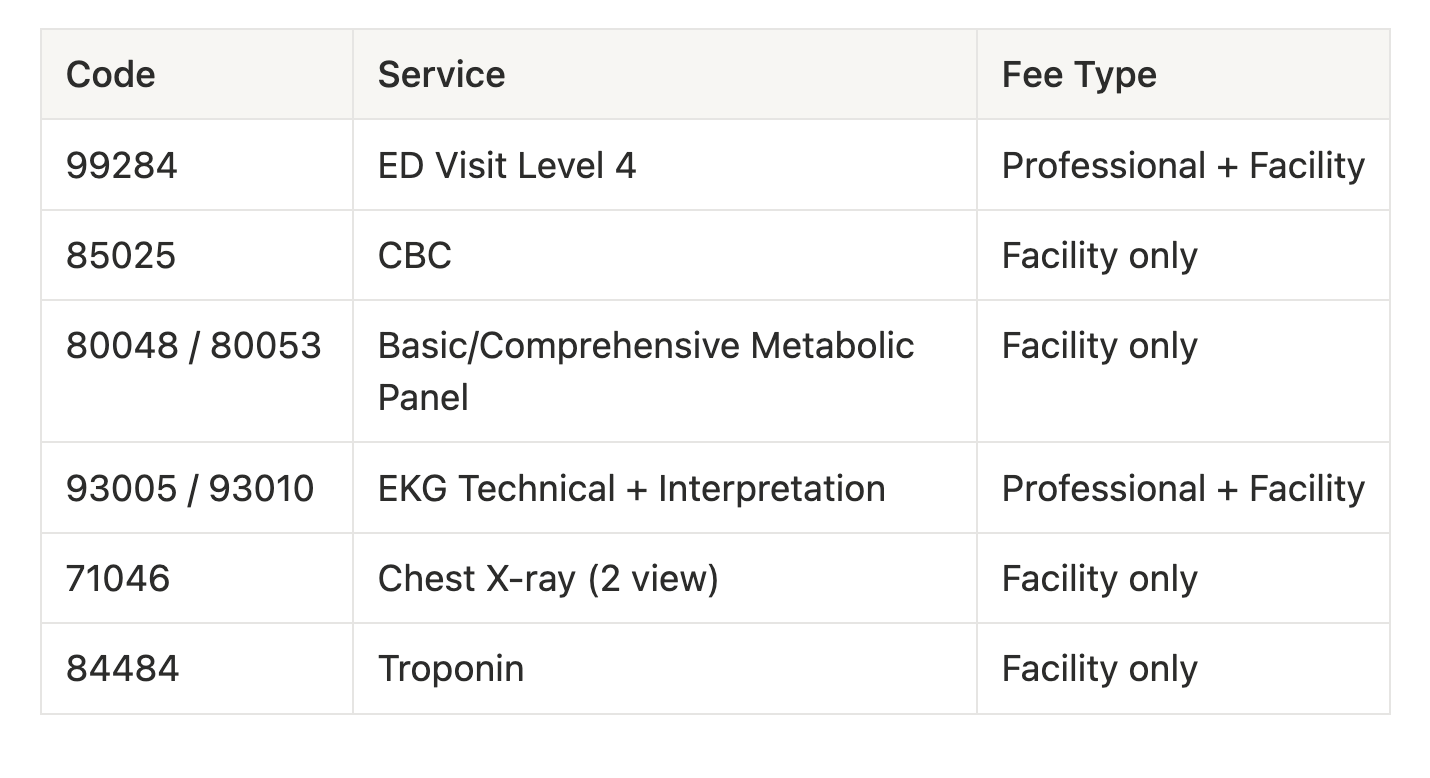
Worth noting: several of those codes split into both a professional and a facility component, specifically the E/M visit itself. Some hospitals bill EKGs globally using 93000, while others split them into the technical (93005) and interpretation (93010) components. Understanding how each organization actually bills is part of the work, and it matters for the comparison.
Once you have your bundle, you need to price it across three separate data sources. Not one, not two. All three.
The Three Data Sources You Need to Triangulate
Payer Machine-Readable Files (Transparency in Coverage)
Commercial carriers are required by law to publish negotiated rates in these files, broken out by plan. This is the closest thing we have to ground truth on what a payer has contractually agreed to pay. Payers are required to post accurate, complete data in these files, and consistent enforcement of that requirement is essential to making price transparency work the way it should.
Several challenges continue to exist as we look to make meaningful use of the information. A couple examples include massive file sizes (several Terabytes and millions of rows per file), expiring access links, API rate throttling, data complexity, and instances of data duplication.
Hospital Machine-Readable Files (Hospital Price Transparency)
Hospitals publish their own pricing files and are required to affirm the accuracy and completeness of their MRFs as of July 1, 2024. These include standard charges, payer-specific negotiated rates, and estimated amounts. We regularly use this data as a cross-check and a supplemental reference as opposed to a primary source. Estimated amounts in hospital MRFs can be tough to decipher, particularly when complex contract structures are involved.
For example, a complex rate analysis occurs if a hospital operates under a percent-of-billed-charges contract. In these cases, the file shows a percentage rather than a dollar amount. You see “68% of billed charges” and still cannot calculate what that means in dollars without knowing the hospital’s actual charge. While these types of arrangements are becoming less common, it’s during times like this that the other sources come in handy.
Claims Data
This is a great sounding board that strengthens hospital benchmarking. Remittance data (835 files) shows the billed amount, allowed amount, paid amount, adjustments / denials, and the patient responsibility across real transactions. When we have several observed remittances for a given set of billing codes, we have a high-confidence picture of what those codes are actually reimbursing in practice.
For percent-of-charge contracts: the payer MRF gives you the rate as a percentage, claims data tells you what the hospital typically charges, and multiplying those together gives you a reliable estimated reimbursement. You then validate that against the actual remittances you have observed. That is where the real picture comes into focus.
What We Found With a Comprehensive Approach
Here is how this plays out with real data. We worked through a comparison of two competing hospitals in the same market: Hospital A and Hospital B, both serving a similar commercial payer mix. We focused on commercial PPO reimbursement using the bundle above.
The original analysis had claimed Hospital A receives 1.5x more than Hospital B. Here is what we found when we applied the full methodology.
Head-to-Head Bundle Comparison — Commercial PPO
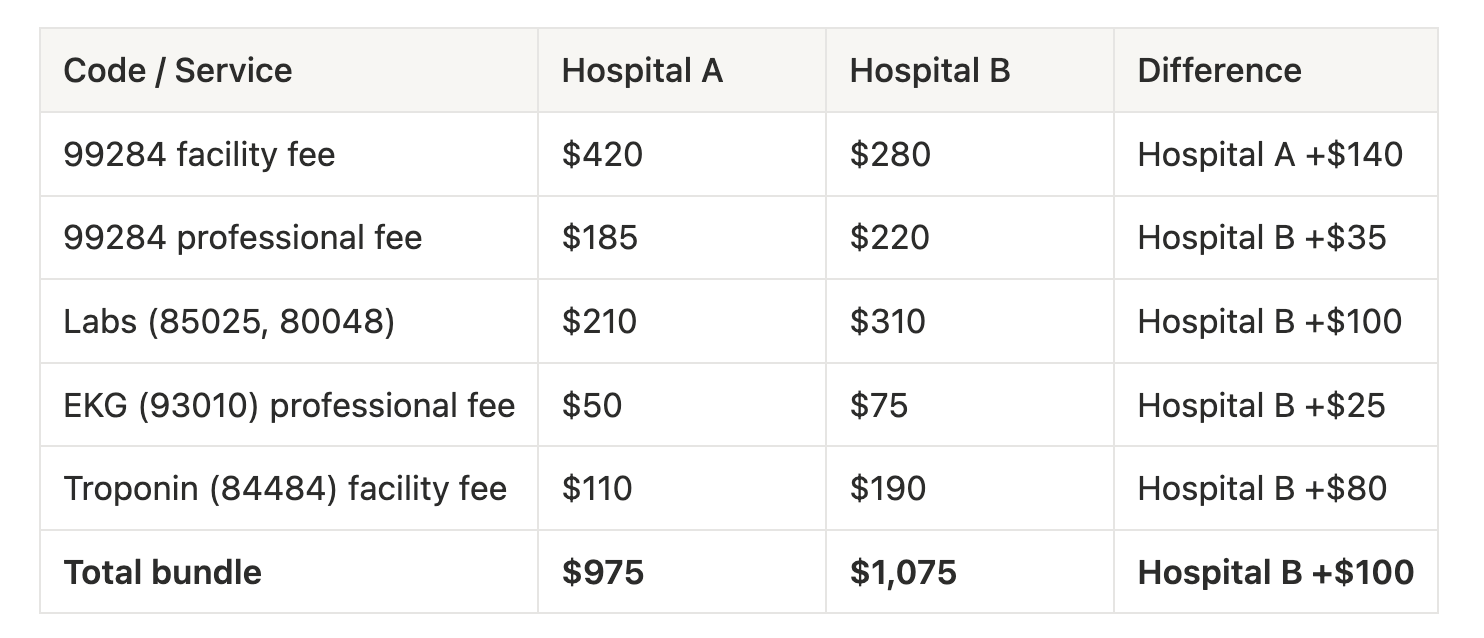
The conclusion flips entirely. Hospital A does receive more on the headline facility fee for the 99284 code, which is exactly what the original analysis highlighted. But once you account for the full visit, Hospital B comes out ahead by roughly $100 per encounter, about 10% higher overall.
Here is the part that really matters. The 99284 facility fee, the single number the original analysis was built on, shows Hospital A higher by a good margin. But then look at what happens in the labs and the rest of the bundle. Hospital B collects significantly more across labs, troponin, and the EKG professional fee. That is where the negotiating leverage actually lives, and it is easy to miss entirely if you are only looking at one code from one source.
A Note About Percent-of-Charge Rates
This kind of analysis also surfaces a challenge worth spending more time on. It’s difficult to analyze hospital reimbursement using price transparency data alone when a hospital operates under a percent-of-charge contract.
Here is how these contracts work. Rather than agreeing to pay a fixed dollar amount for a lab test, the payer agrees to pay a percentage of whatever the hospital bills. If a hospital charges $200 for a metabolic panel under a 65% of billed charges contract, the payer pays $130. If that hospital later updates its chargemaster and raises the charge to $250, the payer pays $163, and the hospital never had to reopen the contract to get there.
Understanding which structure applies to which codes is a prerequisite for meaningful analysis. If you are looking at a payer MRF and seeing a percentage instead of a dollar figure, you are dealing with a percent-of-charge contract, and you will need additional data to make it actionable.
Final Thoughts
Claims data is becoming increasingly valuable for hospital benchmarking. Remittance data unlocks added visibility by going under the hood to help showcase billing patterns, validate reported rates, distill code cohorts, and help close the loop on percent-of-charge contracts.
Federal enforcement energy should remain consistent, focused, and constructive. With the introduction of Schema 2.0, this is a fantastic step forward and even more improvements are coming in 2027 and beyond.
Even a thorough analysis has limits. The methodology we walked through is more accurate than pulling estimated amounts from a hospital MRF for one billing code, but it still involves estimates. Every emergency visit is different. Every contract is different. We are modeling a typical clinical presentation, not a specific patient encounter. The goal is to get directionally right with reasonable confidence, not to manufacture false precision.
This work takes real expertise. We have been doing it alongside managed care professionals for years and still approach every new analysis with humility. If someone tells you price transparency benchmarking is simple or that a tool handles it automatically, that is worth questioning. It takes experienced people to apply this data well. Even with its challenges, the good news is that when you approach this the right way, with the right bundle, the right data sources, and a real understanding of the contract structures involved, you get answers that are genuinely useful. You find out where reimbursement is strong, where there is room to grow, and where to focus energy going into the next negotiation.